The Math of Survival: Risk of Ruin and Smarter Position Sizing for Futures Traders
Position Sizing Is Not Just a Percentage
Most beginners learn one rule: "risk 1% per trade." That's a good start, but it's incomplete. Risking 1% of your account means nothing on its own — what matters is how that 1% translates into contracts, lots, or shares once you know your stop distance and the instrument's volatility.
Two traders can both "risk 1%" on the same NQ setup and end up with completely different outcomes, because one sized the position correctly against the stop and the other just guessed a contract count.
The Core Formula
The foundation of position sizing is simple:
Position Size = Account Risk Amount ÷ Risk Per Unit (stop distance)
Risk per unit is the distance, in dollars, between your entry and your stop. The formula is: Position Size = Maximum Dollar Risk ÷ Risk Per Share. Risk Per Share = Entry Price − Stop Price.
For futures, you replace "shares" with contracts and use the contract's tick value. For example, the E-mini Nasdaq-100 (NQ) contract is worth $20 per index point, while its smaller sibling, the Micro E-mini Nasdaq-100 (MNQ), is worth $20 x the Nasdaq-100 index and has a minimum tick of 0.25 index points for NQ, and just $2 per point for MNQ.
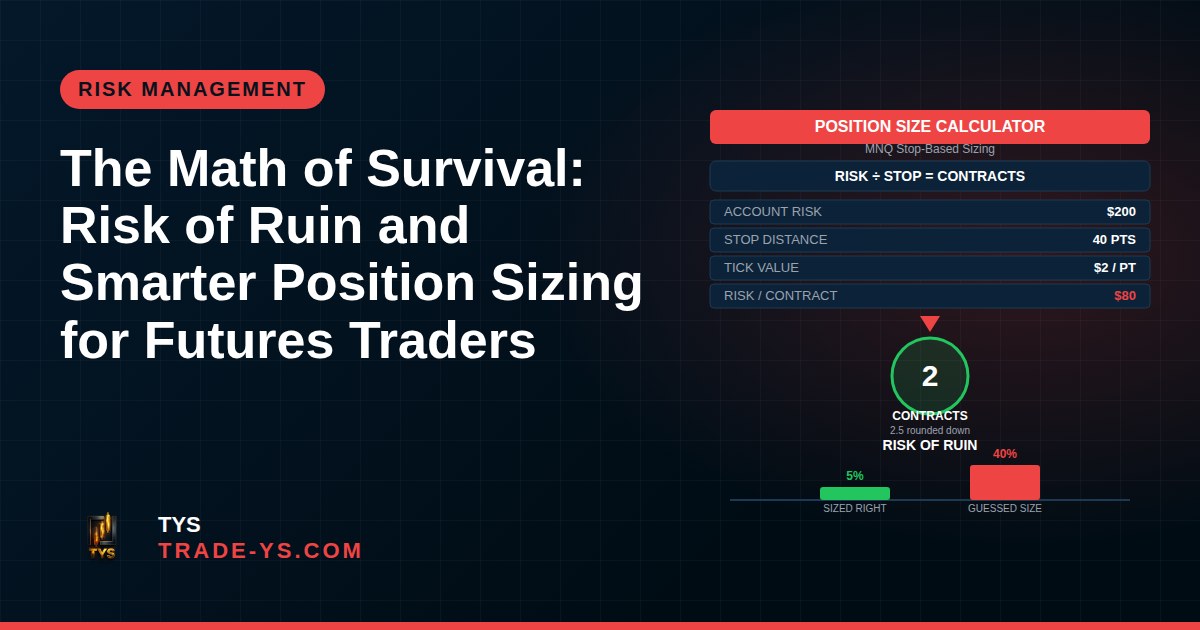
A concrete example: Say your account risk limit is $200 per trade, and your ICT-based stop on MNQ sits 40 points below your entry. At $2 per point, that's $80 of risk per contract. $200 ÷ $80 = 2.5, so you'd round down to 2 contracts. If you tried to trade the same setup with NQ instead (at $20 per point), the same 40-point stop would risk $800 per contract — eight times your limit on a single contract. This is exactly why many retail traders start with micro contracts: MES tracks the S&P 500 at $5 per point with $50-100 margin, while MNQ tracks the Nasdaq 100 at $2 per point with $100-300 margin, making it easier to size small accounts precisely.
Adjusting Size to Volatility, Not Just Distance
A fixed number of points doesn't mean the same thing in a calm market versus a volatile one. That's why many traders anchor their stop — and therefore their position size — to the Average True Range (ATR) rather than a fixed pip or point count. Position sizing using ATR is the technique of calculating your trade size from two inputs: how much money you are willing to lose on the trade, and how far the stop sits in price terms. It removes guesswork and forces every trade to carry the same dollar risk.
The practical benefit: your dollar risk never changes, no matter how much the market moves — if ATR reads higher because volatility is elevated, the same ATR-multiple stop is wider and you simply buy fewer contracts, so account risk stays the same. This matters a lot around high-impact news or overlapping killzones, when NQ and ES ranges can expand suddenly.
The Hidden Killer: Risk of Ruin
"Risk of ruin" is the probability that a string of losses, combined with poor sizing, wipes out your account before your edge has time to play out. It's not about one bad trade — it's about what happens over a sequence of trades.
Two traders can have the identical win rate and risk/reward ratio, yet one survives a losing streak and the other doesn't, purely because of position size. Risking 1% per trade can survive a long losing streak relatively comfortably; risking 5-10% per trade on the same strategy dramatically raises the odds of blowing the account, even with a positive long-term edge. This is the core reason professional risk frameworks — including most prop firm rules — cap risk per trade and per day, regardless of how confident the setup looks.
Don't Forget Correlation
If you trade NQ and ES (or their micro equivalents) in the same session, treating each position as an independent 1% risk can be misleading. Both indices tend to move together during US sessions, especially around the same news releases and killzones. Taking "1% on NQ" and "1% on ES" at the same time can behave more like 1.5-2% of combined directional risk if both trades move against you together. Before stacking correlated positions, it helps to ask: if this trade is wrong, is the other one likely wrong too?
Building a Simple, Repeatable Risk Plan
A workable plan doesn't need to be complicated:
- Decide your maximum risk per trade as a fixed percentage of account equity (commonly 0.5-1% for discretionary trading).
- Define your stop first, based on structure or ATR — never size the position before you know the stop.
- Calculate contracts/lots with the formula above, and round down, not up.
- Set a daily and weekly loss limit so a losing streak doesn't become a ruin event.
- Check correlation before adding a second position in a related instrument.
None of this guarantees profit. What it does is keep you in the game long enough for a tested strategy to actually express its edge over a meaningful sample of trades.
Final Word
Position sizing is where risk management stops being theory and becomes arithmetic. Get the formula right, respect volatility, and treat correlated trades as combined risk — not three separate "safe" 1% bets.
This article is for educational purposes only and is not financial advice. Futures and leveraged products carry a high level of risk and may not be suitable for all investors; past performance does not guarantee future results. Always size positions according to your own risk tolerance and consult independent advice if needed.
If you want to see how we apply these sizing principles around real NQ and ES setups, keep following TYS's daily analysis.