Support and Resistance in Trading
In the world of trading, the concepts of support and resistance are fundamental to technical analysis. These levels are used by traders to identify potential points of price reversal or continuation. Understanding and mastering these concepts can significantly enhance your trading skills and help you make more informed decisions in the market.

What are Support and Resistance?
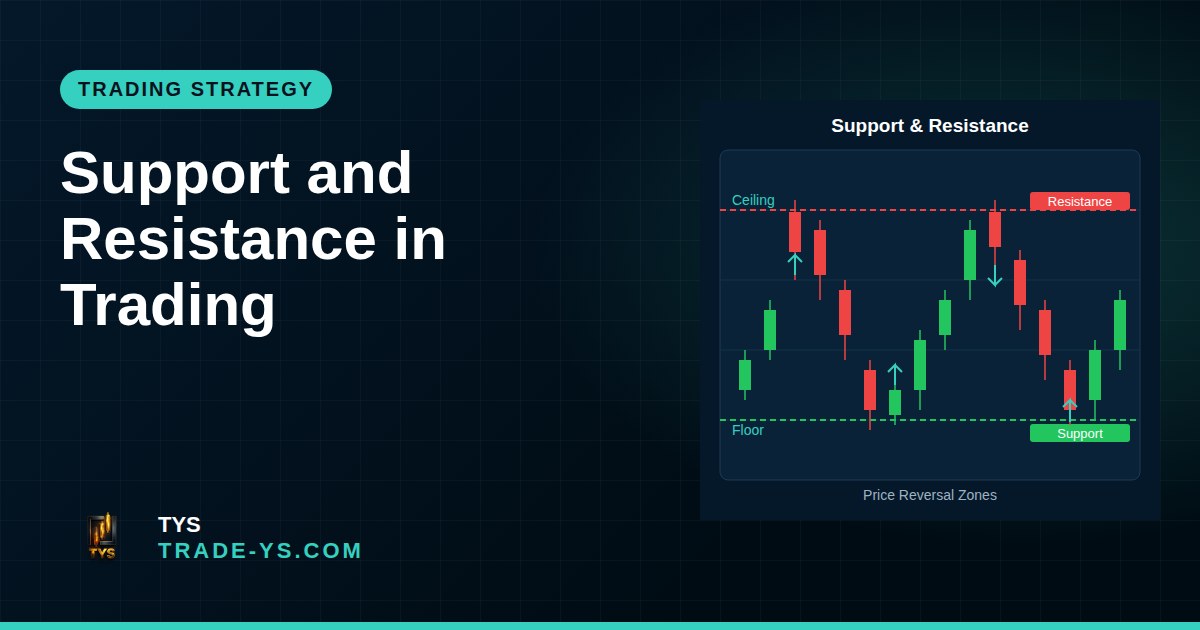
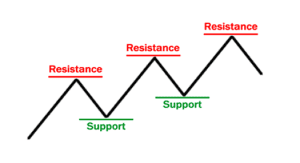
Support and resistance are specific price levels where the forces of supply and demand tend to balance. Here’s a detailed description of each:
-
Support: A support level is a price level where demand is strong enough to prevent the price from declining further. At this level, buyers are more inclined to purchase, creating a “floor” under the prices. If a support level is broken, it can indicate a new downward trend.
-
Resistance: A resistance level is a price level where supply is strong enough to prevent the price from rising further. At this level, sellers are more inclined to sell, creating a “ceiling” above the prices. If a resistance level is broken, it can signal a new upward trend.
Why are They Important?
Support and resistance levels are crucial because they represent points where market sentiment can change. Identifying these levels allows traders to:
- Anticipate Reversals: Prices tend to bounce off supports and pull back from resistances.
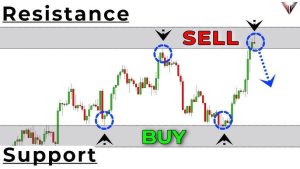
- Define Entry and Exit Points: Traders use these levels to plan their trades, placing buy orders near supports and sell orders near resistances.
- Manage Risk: By placing stop-loss orders below supports and above resistances, traders can limit their potential losses.
How to Identify Support and Resistance?
Several methods exist to identify these key levels:
- Horizontal Levels: These are the simplest and most common methods. Traders look at past prices to spot levels where the price has reversed repeatedly.
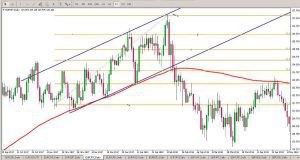
- Trend Lines: By drawing lines connecting highs or lows, traders can identify dynamic support and resistance levels that evolve over time.
- Moving Averages: These indicators can also serve as dynamic support and resistance levels, with prices tending to bounce off these lines.
- Fibonacci Retracements: Used to identify potential reversal levels based on ratios derived from the Fibonacci sequence.
Practical Examples
-
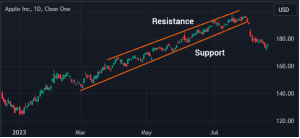
Apple Inc. (AAPL): Suppose a trader observes that repeatedly, the price of Apple stock bounces around $150. This level becomes a key support. If the price breaks this level, it could indicate a new downward trend.
-
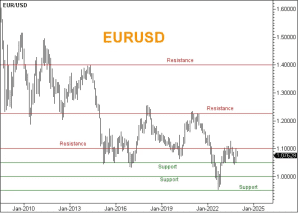
EUR/USD: In the foreign exchange market, a trader may notice that the EUR/USD pair faces strong resistance at 1.2000. Each time the price reaches this level, it falls back. This resistance level becomes crucial for defining exit or sell points.
Contributions from Specialists
Experts and renowned technical analysts like John Murphy and Alexander Elder have significantly contributed to the understanding and use of support and resistance. John Murphy, in his book “Technical Analysis of the Financial Markets”, explains in detail how these levels can be used to analyze trends and forecast future price movements. Alexander Elder, in “Trading for a Living”, offers practical strategies for using these concepts in daily trading.

Conclusion
Support and resistance are indispensable tools for any technical trader. They not only help identify key price reversal points but also allow for more effective risk management. By combining these concepts with other technical indicators and referring to expert analyses, traders can enhance their strategies and performance in financial markets.
Incorporating these principles into your trading approach will better equip you to navigate the markets and make more informed decisions. Always remember that success in trading relies on a combination of analysis, strategy, and discipline.