SMT Divergence: What NQ and ES Disagreeing With Each Other Can Tell You
Two Markets, One Trade?
If you trade both Nasdaq (NQ) and S&P 500 (ES) futures, you might think you're running two separate strategies. Most of the time, you're not. These two index futures are built from overlapping baskets of the same large US companies, and they tend to rise and fall together.
Data from futures research shows the daily-return correlation between NQ and ES measured at 0.927 across 4,471 sessions, and 0.966 over the last 12 months. In plain terms: on most days, if ES is up, NQ is up too — and lately that relationship has been even tighter than usual.
So why does this matter for Smart Money Concepts (SMC/ICT) traders? Because the rare moments when these two markets disagree can be one of the more interesting confirmation tools in the ICT toolbox: SMT divergence.
What Is SMT Divergence?
SMT stands for "Smart Money Technique" (sometimes described as a "crack in correlation"). The idea, popularized within ICT methodology, is simple: SMT trading uses price divergence between related markets to detect hidden strength or weakness, commonly applied to correlated futures contracts like ES vs NQ.
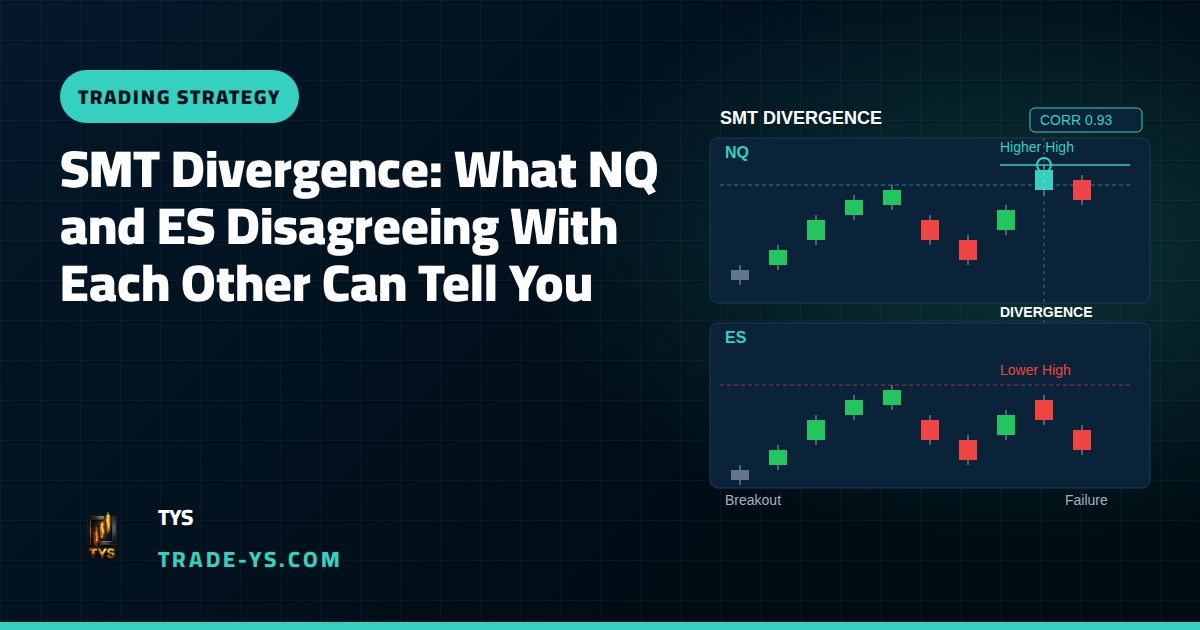
Since NQ and ES are supposed to move in sync, when one instrument fails to confirm the other's swing, it can reveal that smart money is using one instrument to sweep liquidity while the other exposes the lack of true directional conviction.
There are two classic versions of this setup:
- Bearish SMT: ES prints a higher high while NQ fails to confirm with a lower high, indicating potential distribution or a reversal to the downside.
- Bullish SMT: ES prints a lower low while NQ fails to confirm with a higher low, indicating potential accumulation or a reversal to the upside.
A practical version of the same idea: during the U.S. session, ES makes a new high above a prior range while NQ fails to break its own high and starts reversing, signaling potential weakness in the rally.
Why Would They Ever Disagree?
If both contracts track the same large-cap US stocks, divergence sounds odd — but it happens for understandable reasons. A sector-specific regulatory action against a top Nasdaq constituent, or a breakthrough AI product announcement, can move NQ independent of ES entirely. In other words, NQ is far more concentrated in mega-cap technology, so a single earnings report or headline about a chip company can pull it in a different direction than the broader market for a session or two.
A Recent Real-World Example
Mid-October 2026 offered a clean illustration of relative weakness between the two indices. The Nasdaq Composite fell 4.48% and the S&P 500 dropped 1.95% over the week prior to October 19, 2026 — tech-heavy Nasdaq sold off noticeably harder than the broader S&P. That kind of gap, where one index makes a much deeper low than the other relative to its own range, is exactly the type of divergence SMT traders watch for at key swing points.
Then the relationship reconverged: Nasdaq 100 futures gained 0.7% in early trading Monday, October 19, while S&P 500 futures and Dow futures each added roughly 0.4%, as traders positioned ahead of a heavy week of corporate earnings. This is a good reminder that divergence episodes are usually temporary — the two markets tend to pull back toward each other once the news driving the gap is absorbed.
Correlation Is Confirmation, Not a Standalone Signal
It's tempting to build an entire strategy around SMT divergence, but experienced traders treat it carefully. It works best as a confirmation tool, not a standalone signal, and SMT setups work best near key levels or during volatile periods — not in the middle of a quiet session.
There's also an important statistical nuance: correlation isn't fixed. The correlation between NQ and ES actually rises to around 0.94 in high-volatility regimes and falls to around 0.86 in calm ones — meaning the two diversify each other least exactly when a trader might want it most, in a sell-off. Translated into SMC terms: during high-stress, high-volume sessions (think CPI prints, FOMC days, or large liquidity sweeps), NQ and ES tend to move almost in lockstep, which makes a genuine divergence stand out more clearly — and more meaningfully — than during a slow, directionless afternoon.
A Simple Way to Use This
You don't need a dedicated indicator to start paying attention to SMT. A basic routine looks like this:
- Mark the prior session's high and low on both NQ and ES.
- When one index sweeps that level, check whether the other confirms the move.
- If it doesn't — and you're at a logical liquidity pool or key level — treat that as added weight behind a reversal idea, not a signal on its own.
- Combine it with your usual structure, order block, or fair value gap confirmation before considering an entry.
Keep It in Perspective
Correlation doesn't mean one instrument causes the other to move — it simply measures how often they move together, since both respond to overlapping market forces. SMT divergence is a way of reading that relationship, not a guaranteed early-warning system. Markets can stay correlated for long stretches and only occasionally offer a clean divergence worth acting on.
Risk Reminder
This article is educational and does not constitute financial advice. Trading futures such as NQ and ES involves substantial risk of loss, and SMT divergence — like any Smart Money Concepts tool — can fail or give false signals. Always size positions according to a plan you can tolerate, use stops, and never risk money you cannot afford to lose.
Follow TYS for ongoing Nasdaq and S&P 500 analysis built around Smart Money Concepts — one concept, explained simply, at a time.