Smart Money Concepts on NQ and ES Futures: How Institutions Move Price
Why SMC Fits Index Futures So Well
Nasdaq-100 (NQ) and S&P 500 (ES) futures are among the most liquid, most traded contracts in the world. That liquidity is exactly why Smart Money Concepts (SMC) — the retail-friendly branch of ICT thinking — work so well here. Large funds can't just click "buy" on a billion dollars of exposure without moving the market, so they leave footprints: liquidity sweeps, imbalances, and structural shifts that a trained eye can read.
Right now both indices are trading near record territory, with the Nasdaq Composite having closed at an all-time high of 27,244.28 on Tuesday, September 22, 2026. That kind of environment — strong trend, frequent new highs — is actually ideal for practicing SMC, because liquidity pools above old highs keep getting targeted before genuine reversals or continuations happen.
The Building Blocks, Applied to NQ/ES
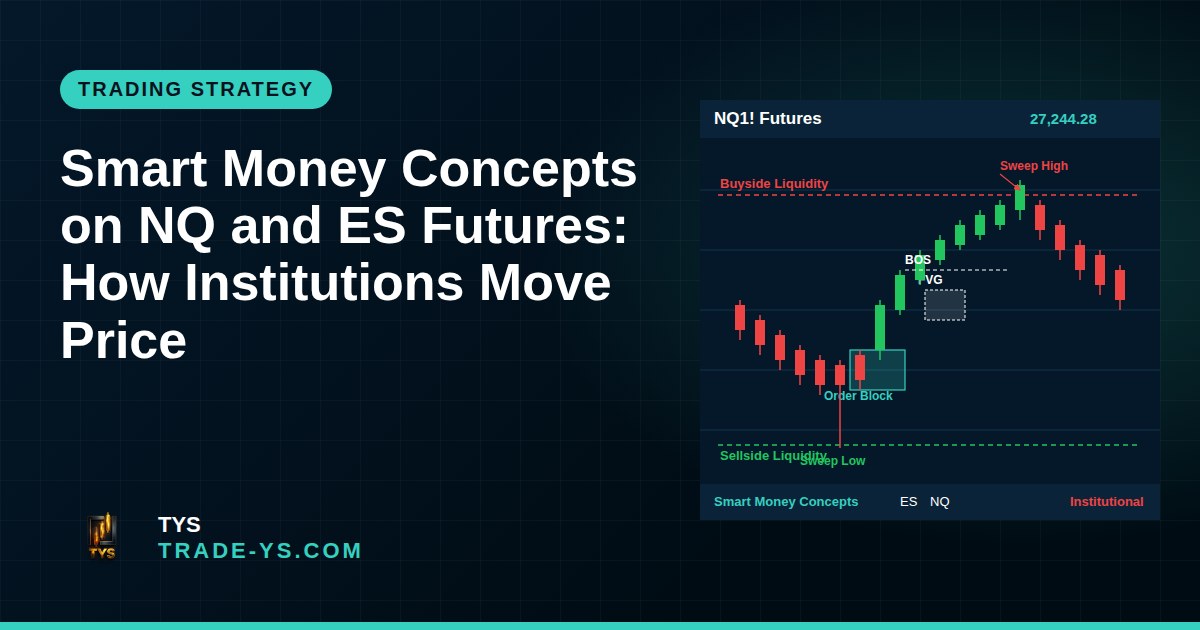
Liquidity pools. Every swing high or low on your NQ or ES chart is a magnet. Retail stop-losses and breakout orders cluster just above highs and just below lows. Smart money often pushes price into these zones to fill large orders before reversing — this is the classic "stop hunt" or liquidity sweep.
Order blocks. An order block is the last opposing candle before a strong, impulsive move. On ES, this often appears right before a sharp rally into the New York open. When price returns to that zone later, it can act as support or resistance because unfilled institutional orders may still sit there.
Fair Value Gaps (FVGs). Index futures move fast, especially around economic releases. A three-candle imbalance where price "skips" a zone represents an FVG. NQ, being more volatile than ES, tends to produce larger, more frequent gaps — many traders watch for price to return and "fill" part of that gap before continuing.
Market structure shifts (MSS). When a sequence of higher highs and higher lows breaks, that's your signal the short-term trend may be changing. On futures, this is often confirmed with a decisive break of a recent swing low or high, accompanied by stronger volume.
A Simple NQ Example
Imagine NQ is trending up through the London and early New York session. Price sweeps a previous session's high, triggering buy-stops, then sharply reverses and breaks below the most recent higher low — a market structure shift to the downside. Price then rallies back weakly into a bearish order block or an unfilled FVG from the drop. If it reacts there with rejection, SMC traders see this as a potential continuation point to the downside. None of this guarantees direction — it's a framework for probability, not certainty.
Why NQ Behaves Differently Than ES
Nasdaq futures are concentrated in mega-cap technology names, which makes NQ more reactive to AI-sector news, big tech earnings, and rate expectations than the broader ES. Recent sessions have shown this clearly: a relentless rally in technology and AI names has played a big role in pushing U.S. stocks to fresh highs as investors cheered a strong earnings season and upbeat economic data. That means NQ often moves with sharper, faster swings — bigger FVGs, more violent liquidity sweeps — while ES, backed by 500 diversified companies, tends to be comparatively smoother.
Both contracts share the same CME infrastructure: ES futures trade nearly 24 hours a day, Sunday evening through Friday afternoon, and expire quarterly in March, June, September, and December. NQ follows the same quarterly cycle and near-24-hour session, which is why session timing (Asia, London, New York) matters so much when mapping liquidity levels — each session tends to build its own high and low that later gets targeted.
Context Matters: Read the Macro Backdrop
SMC is a lens for price action, not a replacement for context. Breadth and valuation signals are worth watching alongside your charts. One notable observation this year: market commentary has flagged that "S&P 500 breadth is flashing a signal not seen since the 2000 Dot-Com Bubble: The S&P 500 is trading within 1% of an all-time high, while over 70% of its stocks are at least -10% below their own highs." That kind of divergence between the index and its components is exactly the sort of macro detail that should inform how aggressively you trust a liquidity sweep or structure shift — concentrated leadership can mean sharper, faster reversals when sentiment turns.
Putting It Together
A practical SMC routine on NQ/ES looks like this:
- Mark the prior day's and session's high/low — these are your primary liquidity pools.
- Watch for a sweep of one of these levels, ideally with some loss of momentum.
- Look for a market structure shift on a lower timeframe (1–5 minute) to confirm a potential turn.
- Identify the order block or FVG left behind by the impulsive move away from the sweep.
- Wait for price to return to that zone and react before considering any decision — patience is the discipline most new traders skip.
Risk Reminder
Index futures like NQ and ES are leveraged, fast-moving instruments. Smart Money Concepts can help you structure your reading of price action, but no method predicts the market with certainty. Always use a clear risk management plan, size positions according to your own risk tolerance, and never trade money you cannot afford to lose. Nothing in this article is financial advice.
If you want to see these concepts applied live on NQ and ES charts, follow TYS's ongoing analysis — we break down real sessions, not just theory.