Liquidity, Order Blocks, FVGs and Structure Shifts: ICT Concepts in Plain English
Why ICT Traders Talk About Liquidity Before Anything Else
If you've spent any time around ICT (Inner Circle Trader) content, you've heard the words "liquidity," "order block," "fair value gap," and "market structure shift" thrown around like they're obvious. They're not — until someone breaks them down in plain language. That's the goal of this article.
ICT is a price-action methodology built by trader Michael J. Huddleston, and at its core it focuses on understanding how institutional traders and market makers move price through liquidity pools, order blocks, fair value gaps, and market structure shifts, teaching traders to anticipate where smart money will drive price next rather than relying solely on lagging indicators.
Let's go through the four pieces one at a time, then look at a real example from the Nasdaq this month.
Liquidity: The Fuel Behind Every Big Move
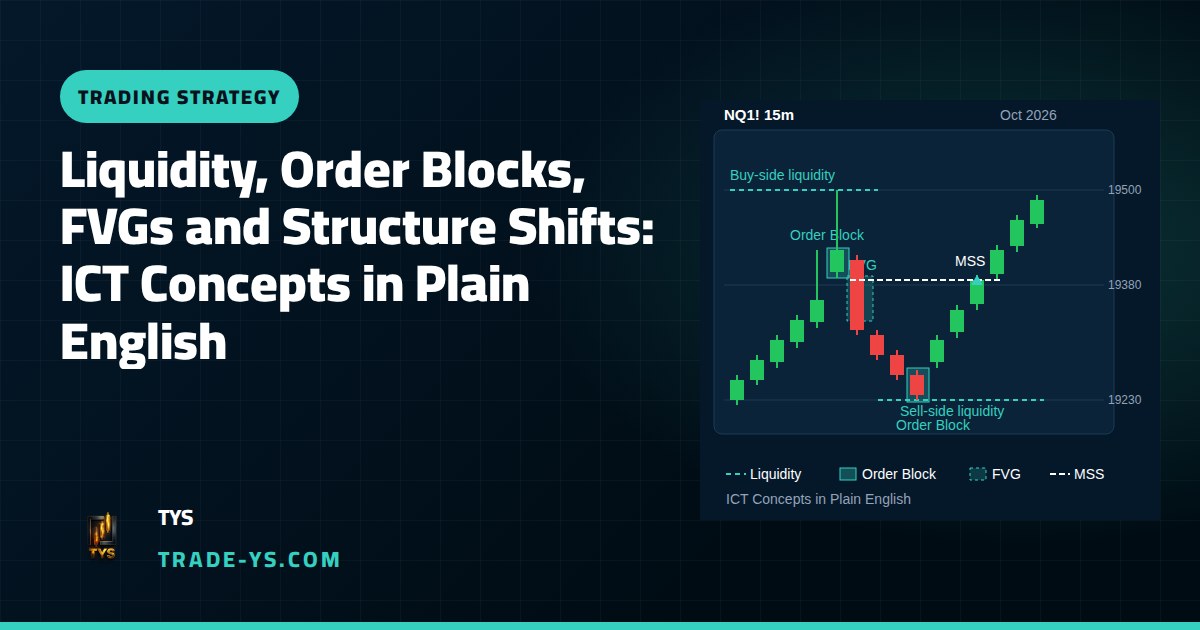
In everyday language, "liquidity" just means how easy it is to buy or sell. In ICT terms, it's more specific: liquidity pools are concentrations of resting orders on a price chart — stop-losses, take-profits, and pending limit orders.
Why does this matter? Large institutions require significant opposing orders to execute their vast trades without causing substantial price swings, and liquidity pools provide precisely that. In practice, these big players often target areas with many clustered orders, typically just above recent swing highs (buy-side liquidity) or below recent swing lows (sell-side liquidity).
When price spikes through one of these levels and then reverses, that's a liquidity sweep, often called a stop hunt. As one educational guide puts it: a liquidity sweep is when price spikes through a level, triggers the resting orders, and then reverses — and that failed breakout you keep getting caught in isn't random, it's a sweep that often fuels the real move in the opposite direction.
Order Blocks and Fair Value Gaps: The Footprints Left Behind
Once a sweep happens and price starts moving hard in the new direction, two footprints usually show up.
The first is the order block — the final opposing price candle right before an impulsive expansion that breaks market structure. Think of it as the last place sellers were still in control before buyers took over (or vice versa).
The second is the fair value gap (FVG) — a three-candle imbalance where aggressive institutional volume overwhelmed the opposing orders. It shows up as a visible gap between candle wicks, and ICT traders watch these zones because price often returns to "fill" them before continuing.
Together, these two concepts give traders a map of where institutional buying or selling pressure likely originated — useful reference points, not magic guarantees.
Market Structure Shift: The Confirmation Step
A market structure shift (MSS, sometimes called CHoCH) is what tells you the sweep actually meant something. Market Structure Shifts confirm an intentional directional change after a liquidity pool has been cleared. Technically, it's a candle body closing through the most recent swing point in the opposite direction of the sweep, confirming the trend change.
This is the piece that stops traders from guessing. A sweep alone isn't a signal — plenty of sweeps just continue in the same direction. It's the sweep plus the structure shift that builds the ICT sequence: liquidity grab, displacement, then confirmation.
A Real Example: The Nasdaq's October 2026 Round Trip
Here's how this played out recently, using publicly reported price action rather than a hypothetical.
The week before October 19, 2026 was the worst week for the Nasdaq since April 2025 and the "Liberation Day" tariff turmoil, with the largest jump in the VIX since June and the longest losing streak for the SOXX semiconductor index since 2008. Sellers had clearly taken sell-side liquidity below prior swing lows.
Then, on the Monday open, Nasdaq futures surged in Asian trade, reversing an initial gap lower to gain 1.6% during the opening four hours of trade. One trading desk's overnight recap noted that Nasdaq futures ran from a Sunday-night low of 29,226 to a Monday high of 29,983.50, about 76% of the prior leg down from the October 16 lower high at 30,225.
That's a textbook ICT sequence in miniature: a sweep of recent lows into a stretch of heavy selling, followed by a sharp reversal that reclaimed a large chunk of the move — the kind of price behavior ICT traders describe as a liquidity grab followed by a shift in delivery. It doesn't mean every sweep resolves this cleanly, and the rebound still had to prove itself against a backdrop of elevated Treasury yields and cautious earnings-week positioning. But it's a useful, real-world illustration of why ICT traders watch liquidity levels before they watch indicators.
Keeping the Concepts in Perspective
None of this — order blocks, FVGs, liquidity sweeps, or structure shifts — is a crystal ball. They're a way of reading why price might move, based on where orders are likely resting. Markets can sweep a level and keep going instead of reversing. Confirmation (the structure shift) matters precisely because sweeps alone aren't signals.
Risk Reminder
This article is for educational purposes only and is not financial advice or a signal to buy or sell anything. Trading futures and other leveraged instruments carries a high risk of loss, and past price behavior — including the examples above — does not guarantee future results. Always use proper position sizing and risk management, and only trade with capital you can afford to lose.
Keep Learning With TYS
If you found this breakdown useful, keep an eye on TYS for more plain-language walkthroughs of ICT concepts applied to real Nasdaq and S&P futures price action — no hype, just the logic behind the charts.