ICT Concepts Made Simple: Order Blocks, Fair Value Gaps, Liquidity and Market Structure Shifts
Why ICT Feels Confusing at First
If you've spent any time around Smart Money or ICT content, you've probably felt overwhelmed by the vocabulary: BOS, CHoCH, MSS, OB, FVG, kill zones... It sounds complicated, but the underlying idea is simple.
ICT (Inner Circle Trader) is a price-based methodology developed by Michael J. Huddleston that offers a way to read institutional behaviour in the markets. It is a group of price-action tools that explain how large players — banks, funds, institutions — actually move the market, instead of relying only on classic indicators.
Today we'll break down the four concepts you need to understand first, in the order they usually appear on a chart.
1. Liquidity: Where the Orders Are Resting
Every price move needs "fuel." That fuel is liquidity — the stop-loss and pending orders sitting above old highs and below old lows.
Resting stop orders above swing highs and swing lows serve as the primary targets for smart money positioning. Traders who expect further upside place buy-stop orders above recent highs, while traders in short positions place their take-profit orders in the same area — creating a pool of orders that price is naturally drawn to.
This is why price often spikes just above an obvious high (or below an obvious low), triggers those orders, and then reverses. In ICT language, that's a "liquidity sweep" or "liquidity raid": price pushes cleanly through a recent swing high or swing low, trapping breakout traders and triggering stop orders, before reversing sharply.
2. Market Structure Shift (MSS): The Signal Something Changed
Once liquidity has been swept, ICT traders watch for confirmation that direction has actually changed — not just a temporary pullback.
A Market Structure Shift happens when a strong, wide-bodied candle (called a displacement candle) breaks and closes decisively beyond the most recent opposing swing point, confirming that control has shifted from buyers to sellers, or vice versa. This is different from a simple "break of structure" (BOS), which usually confirms an existing trend; an MSS (sometimes called CHoCH — Change of Character) signals a potential reversal.
3. Order Blocks: Footprints of Institutional Orders
An order block is the last candle in the opposite direction right before that strong displacement move. Order blocks reveal institutional footprints: the final opposing candle before an aggressive structural move marks where large institutions likely placed orders.
Not every candle before a big move qualifies, though. A valid bullish order block typically needs to sweep the low of the previous candle before reversing upward — that liquidity sweep is what confirms manipulation before the shift, rather than a random-looking bounce.
4. Fair Value Gaps (FVG): The Imbalance Left Behind
When price moves fast and aggressively (during that displacement), it often leaves a "gap" — an area where very little trading actually happened. This is the Fair Value Gap: a three-candle sequence where the wick of the first candle and the wick of the third candle don't overlap, leaving an open imbalance in the middle candle.
Institutions may revisit these gaps later to rebalance orders and fill liquidity voids, which is why price frequently returns to an FVG before continuing in the original direction. Traders watch these zones closely, since price often reacts to them with precision, especially when the gap lines up with an order block or a structure break.
Putting It Together: A Simple Example
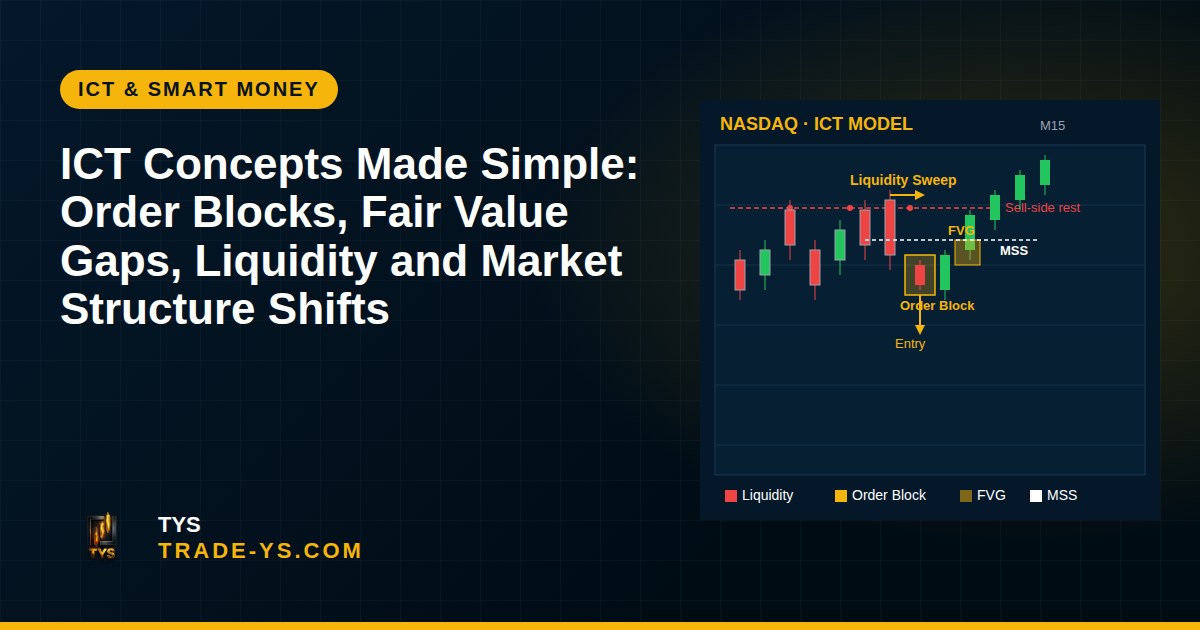
Imagine the Nasdaq-100 is grinding higher and prints a new all-time high — something the index has actually done recently, with the Nasdaq Composite and Nasdaq-100 both closing at record levels in late September 2026. Sitting just above that record are resting buy stops and breakout orders: sell-side and buy-side liquidity.
Price spikes above the old high, sweeps that liquidity, then reverses hard with a large bearish candle that closes below the previous swing low — that's your Market Structure Shift. The last bullish candle before that reversal is your order block. And the gap left by the sharp down-move is your Fair Value Gap. A trader following ICT concepts would wait for price to pull back into that order block or FVG zone before considering the setup valid — always confirming with their own analysis rather than acting on the pattern alone.
Why These Concepts Work Together
None of these four ideas is meant to be used alone. ICT combines structure, timing, and context, making it a detailed but discretionary approach to reading price. Liquidity tells you where price is likely heading; the MSS tells you when direction has actually changed; the order block and FVG tell you where price might return to before continuing. It's the combination — not any single tool — that gives the framework its structure.
Keep It Simple as You Start
You don't need to master kill zones, premium/discount arrays or optimal trade entries on day one. Start by learning to spot swing highs/lows, then liquidity sweeps, then structure shifts. Add order blocks and FVGs once the first two feel natural. Like any skill, this takes screen time and patience.
Risk Reminder
Trading involves substantial risk of loss and is not suitable for every investor. ICT concepts, like any analytical framework, do not guarantee profits and should never be used as the sole basis for a trading decision. Always practise proper risk management, and consider seeking independent financial advice before trading with real capital.
Want to see these concepts applied to live Nasdaq charts? Follow TYS's ongoing analysis for more practical breakdowns.