How Many Trades Does It Take to Trust a Backtest? Sample Size, Expectancy, and the Journal That Ties It Together
How Many Trades Does It Take to Trust a Backtest?
Most traders backtest for a weekend, see a handful of winning trades, and decide they've "found an edge." Then they go live, hit a losing streak, and assume the strategy is broken. In reality, the strategy was never properly tested — the sample was too small to mean anything.
This article looks at backtesting and journaling from a different angle: not just why you should do it, but how many trades you actually need before you can trust the numbers, and which metrics in your journal tell you the truth.
"It Worked Last Week" Is Not Evidence
A backtest is simply the process of applying a trading strategy to historical market data to measure how it would have performed. The goal is to assess the viability of the strategy by determining how it would play out using historical data, applying that data to the model to determine its accuracy.
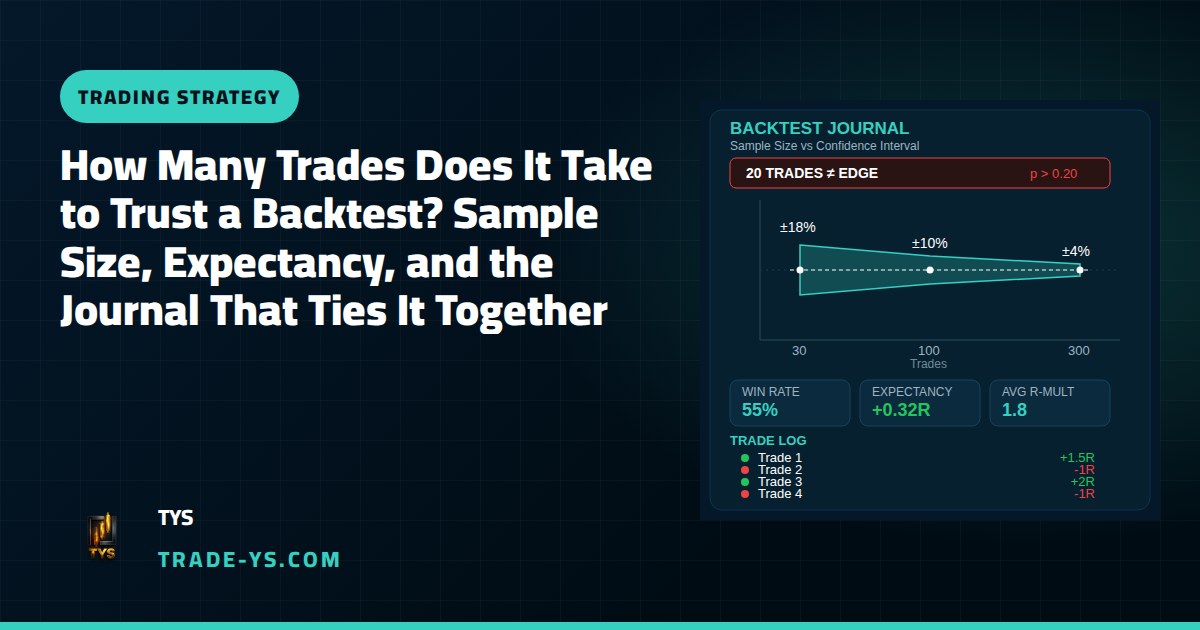
The problem is sample size. Your backtest win rate is only an estimate of your strategy's true win rate, and that estimate comes with error bars. One source puts it clearly: at 30 trades the 95% confidence interval on your win rate can be roughly ±18 percentage points, narrowing to about ±10 percentage points at 100 trades, and only getting genuinely tight around 300 trades. In practical terms, a strategy that shows a 65% win rate over just 20 trades isn't necessarily good — that result still has a p-value above 0.2, meaning there's more than a 20% chance the win rate is just noise.
That's why "it worked for two weeks" rarely counts as evidence — two weeks of day trading is usually only 15–40 trades, which sits on the worst part of the statistical curve.
So How Many Trades Do You Need?
There's no single magic number, but recurring benchmarks show up across trading education resources:
- A commonly cited rule of thumb is that you need at least 30 trades to even begin estimating significance, a figure drawn from the central limit theorem.
- For something you'd actually trade live, several guides recommend going further: a minimum of 50 trades to say anything meaningful, and 100 or more before risking real capital.
- For day-trading style strategies that fire often, the bar is higher still — one guide suggests at least 500+ trades for day trading strategies versus 200+ for swing trading and 100+ for position trading, because frequent, correlated setups need a larger sample to average out.
- Data period matters as much as trade count: test across a minimum of two years, and if your strategy only triggers ten times per year, you need ten-plus years of data to get a meaningful sample.
The practical takeaway for an ICT-style or price-action trader: don't trust a setup after ten backtested examples, however clean they look on the chart. Log 50, then 100, before adjusting your size, and keep testing across different market conditions, not just one trending month.
Win Rate Lies Alone — Track Expectancy Instead
A high win rate feels good but can still bleed your account. As one journal-tracking resource puts it, win rate alone is misleading — a 70% win rate with a 3:1 loss-to-win ratio still loses money. The number that actually tells you whether a strategy makes sense is expectancy:
Expectancy = (Win rate × average win in R) − (Loss rate × average loss in R)
An edge is a positive average result per trade, measured over enough trades that one or two of them cannot set the average, and it has two components: win rate and average R-multiple. The same source shows how a 35% win rate with a 3.5R average winner can produce higher expectancy (+0.64R) than a 65% win rate with a 0.8R average winner (+0.17R) — the lowest win rate in the comparison does not produce the lowest expectancy, because win rate alone does not decide the result.
R-multiple is what lets you compare trades of different sizes fairly: it expresses each trade's outcome as a multiple of the risk taken — if you risked $200 and made $600, that trade was +3R, and a $200 loss was -1R.
A Simple Example
Imagine you backtest a liquidity-sweep-plus-FVG entry on NQ futures across 120 trades over eight months. You log every trade with: date, session, entry, stop, exit, position size, P&L, R-multiple, and a one-line note on the setup. At the end, your numbers show a 42% win rate, an average winner of +2.3R, and an average loser of -1R.
Expectancy = (0.42 × 2.3) − (0.58 × 1) = 0.966 − 0.58 = +0.39R per trade.
That's a positive, survivable edge — but it only means something because the sample is 120 trades, not 12. If you had stopped at trade 15 after two lucky winners, you'd have no real information at all.
Turning the Backtest Into a Live Journal
A backtest only tells you what would have happened under ideal, often simplified conditions. The next step is forward testing — stress-testing results with out-of-sample data, then transitioning from backtest to live trading gradually: paper trade first, then small size, then full size.
Your journal is where backtest assumptions meet live reality. Spreads, slippage, hesitation, and missed entries all show up here. Track the same core fields every time: setup tag, session, planned R, actual R, and a short note on execution quality. Review it weekly, not just at month-end, so patterns surface while they're still fixable.
Mistakes That Quietly Poison a Backtest
A few habits ruin otherwise useful data:
- Curve-fitting — tweaking rules repeatedly until the historical data looks perfect, which guarantees it won't repeat live.
- Cherry-picking the sample — testing only a strong trending month instead of ranging and volatile periods too.
- Ignoring correlated trades — ten trades riding the same trend aren't ten independent data points; correlation quietly shrinks your real sample size.
- Skipping costs — commissions, spread, and realistic slippage change expectancy meaningfully over hundreds of trades.
Risk Reminder
Backtesting and journaling help you understand a strategy's historical behavior and your own execution — they do not predict or guarantee future results. Markets change, past performance is not indicative of future outcomes, and all trading involves risk of loss. Always size positions according to a plan you can survive, and never risk money you cannot afford to lose.
If you want to see how this kind of process-driven approach applies to NQ and ES setups in real time, you're welcome to follow TYS's ongoing analysis and breakdowns.