From Liquidity Sweep to Entry: How ICT Concepts Fit Together in One Sequence
Four Puzzle Pieces, One Picture
If you've spent any time around ICT (Inner Circle Trader) or Smart Money Concepts content, you've probably met the four big words: liquidity, order block, fair value gap, market structure shift. Most beginners learn them as separate flashcards. The real skill is seeing how they connect, in order, inside a single price move.
This article walks through that sequence step by step, using one simple logic chain instead of four disconnected definitions.
Step 1: Liquidity — Where the Stops Are Resting
Every chart has "obvious" levels: a recent high, a recent low, an equal-highs pattern. Retail traders place stop-losses and breakout orders just beyond these levels. In ICT language, that cluster of orders is called liquidity — it's fuel that large players need in order to fill big positions without moving the market against themselves.
Step 2: The Sweep — Smart Money Grabs That Fuel
Before a real move, price often pokes just beyond one of those obvious levels, triggers the resting stop orders, then snaps back. A liquidity sweep is a market move in which price deliberately extends beyond a well-defined high or low to trigger clustered stop losses and pending orders, allowing large participants to access liquidity, and it is typically followed by rejection or reversal, revealing the true directional intent of institutional order flow. This is why so many breakouts fail right after they happen — it wasn't a real breakout, it was a liquidity grab.
Step 3: Market Structure Shift — The Signal Changes
Once the sweep happens, watch what price does next. If it reverses hard and breaks a recent internal high or low in the opposite direction, that's a market structure shift (MSS). A Market Structure Shift is a sharp reversal in direction of the trend that confirms momentum has reversed. This is the moment the short-term story on the chart actually changes — from "sellers in control" to "buyers in control," or vice versa.
Step 4: Order Block — The Footprint Left Behind
The structure shift doesn't come out of nowhere. It usually launches from a specific candle or small cluster of candles — the last point where the losing side was still placing orders before institutions overwhelmed them. Order blocks are levels or areas where "smart money," such as banks or institutional traders, have placed large buy/sell orders, and these blocks can act as future points of interest where the price might react due to leftover or renewed interest from market participants. A valid one usually needs to tick several boxes: it must sweep liquidity, create imbalance, stay untouched, and cause a structure break.
Step 5: Fair Value Gap — The Magnet That Pulls Price Back
The explosive move away from the order block rarely trades cleanly — it often leaves a gap where price jumped so fast that one side of the market (buyers or sellers) never got filled. A Fair Value Gap is a price void or imbalance left when the market surges aggressively in one direction, usually triggered by institutional orders that overwhelm the available liquidity, creating a short-term vacuum where price didn't efficiently fill both sides, and these gaps often attract price back to rebalance or continue institutional flow.
Putting the Sequence Together
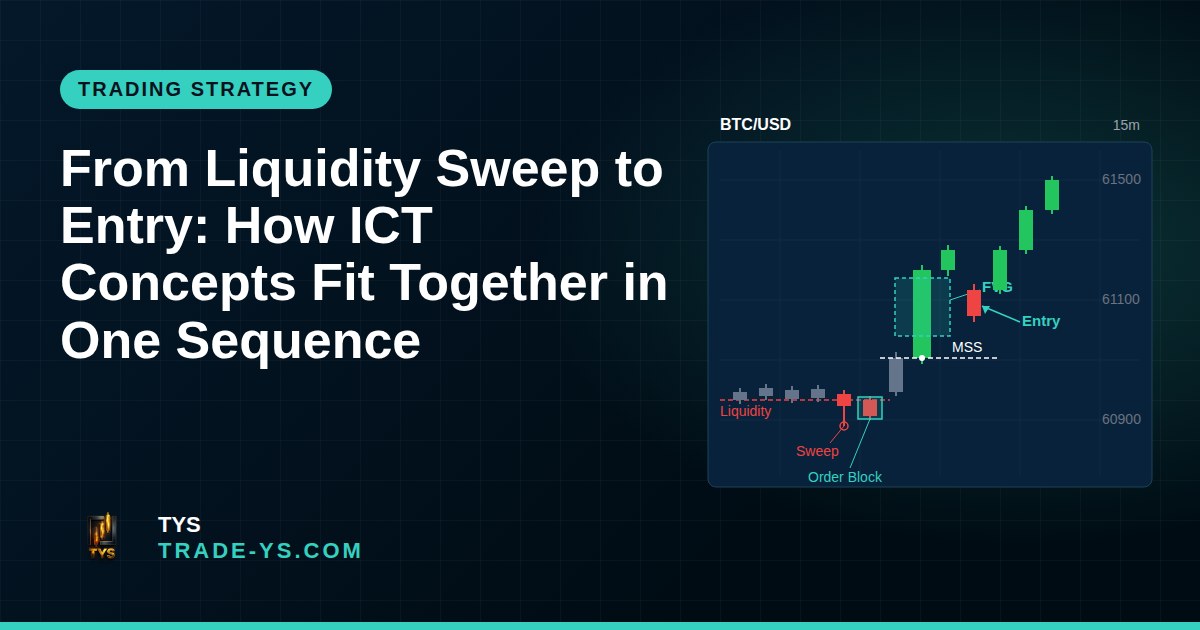
In practice, traders who use this framework tend to follow roughly this order of events: a liquidity sweep hunts opposing retail stops to build institutional volume, the fair value gap is the rapid directional displacement that leaves price imbalances behind, and the order block is the precise candle footprint where large-scale orders were finalized. Seen this way, the four concepts aren't separate tools — they're four chapters of the same story: sweep liquidity → shift structure → leave a footprint (order block) → leave a gap (FVG) that price may revisit before continuing.
A Real Backdrop: Nasdaq's October 2026 Swing
You don't need an exotic example to see this logic at work — regular index behavior shows the same mechanics. In early October 2026, the Nasdaq-100 pushed to fresh record highs, up 1% on the week to a new record high even as 10-year Treasury yields rose to nearly 5.3%, their highest level since 2002. Just days later, sentiment flipped sharply: the Nasdaq dropped more than 1%, marking its biggest one-day loss since mid-August, after climbing to fresh all-time records earlier in the week. That kind of record-high-then-sharp-reversal pattern is exactly the environment where liquidity sweeps and structure shifts tend to show up on lower timeframes — highs get taken out, stops get triggered, and then the move reverses.
A Word of Caution
None of these tools work in isolation, and none of them are magic. Touching a zone is a location, not a trigger — most consistent traders wait for a reaction inside the zone, such as a rejection candle or a shift in lower-timeframe structure, before entering, because arriving at a price doesn't prove a zone is being defended. Context — higher timeframe trend, news events, overall market structure — always matters more than any single pattern on its own.
Keep It Simple, Keep It Safe
You don't need to spot every sweep, every order block, and every FVG perfectly to trade well. Start by simply labeling the last clear high/low (liquidity), watching for a sweep, and then checking whether structure actually shifts afterward. Add order blocks and FVGs once that first step feels natural.
Risk Reminder
This article is for education only and is not financial advice. ICT and Smart Money concepts describe ways to read price action — they do not guarantee profits, and every trade carries risk of loss. Always use proper position sizing, a clear invalidation point, and never risk money you cannot afford to lose.
Want to see these ideas applied to live Nasdaq and futures charts? Follow TYS's analysis for ongoing, practical breakdowns.