Backtesting and Journaling: How to Actually Prove Your Strategy Works
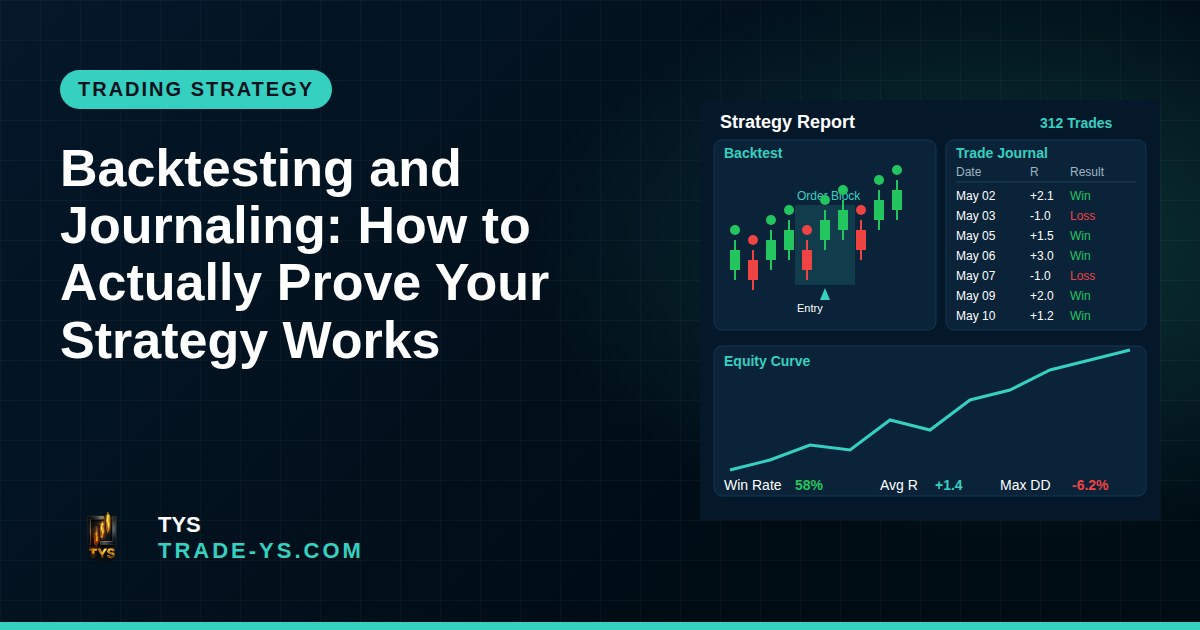
Why "I Think It Works" Isn't Good Enough
Every trader has a setup they "feel" is profitable. ICT order blocks, a liquidity sweep into a fair value gap, a moving average cross — it looks great on the five charts you remember. The problem is memory is selective. You remember the wins and forget the string of small losses.
Backtesting and journaling fix that. One tests the strategy on the past before you risk money; the other tracks it in real time once you're live. Together they turn a hunch into a measurable edge — or prove there isn't one, before it costs you real capital.
Step 1: Write the Rules Down First
Before touching a single chart, your strategy needs to be specific enough that someone else could follow it without asking you questions. Entry trigger, stop location, target, position size, and what market conditions you take the setup in. Vague rules like "enter when it looks like a reversal" cannot be backtested, because every past trade becomes a judgment call made with hindsight.
Step 2: Choose Enough Data — Sample Size Is Everything
This is where most beginners go wrong: they test 10 or 15 trades, see a few wins, and decide the strategy is "proven." Random chance alone can produce a short winning streak.
Across trading education sources, the consensus is consistent: a backtest based on 10 or 15 trades tells you almost nothing statistically meaningful, since random chance can produce a handful of wins. Most professional traders require a minimum of 50 trades — and prefer 100 or more — before drawing any conclusions about a strategy's viability. Some educators push this further, noting that at minimum, 100 trades are needed, and for higher confidence, 200-300 trades give far stronger evidence.
The required sample also depends on how often your strategy trades. Test across a minimum of 2 years and at least 100 trade instances — if your strategy only triggers 10 times per year, you need 10+ years of data to get a meaningful sample. A scalping strategy on NQ futures might reach 100 trades in a month; a weekly swing setup could take years.
Step 3: Split Your Data — Don't Test on What You Already "Know"
A common trap is building a strategy by studying the same data you later test it on. As one guide puts it, if you build your strategy by studying historical data and then test it on the same data, you are measuring how well you memorized the past, not whether the strategy has a genuine edge — reserve a portion of your data as out-of-sample data that you do not touch until after the strategy is finalized.
A simple version of this: develop and tweak your rules on 2021–2023 data, then run the finalized rules untouched on 2024–2025 data. If the edge survives data it has never "seen," that's a much stronger signal than a single smooth backtest.
Step 4: Know Which Numbers Actually Matter
Win rate is the number every beginner obsesses over, but on its own it's misleading. As one trading education resource explains, win rate is the most intuitive performance metric and the one most beginners fixate on — a 70% win rate sounds better than a 40% win rate, but win rate alone tells you almost nothing about profitability.
What actually matters is expectancy — how much you make, on average, per trade. The formula is simple:
Expectancy = (Win Rate × Average Win) − (Loss Rate × Average Loss)
For example, a strategy that wins 45% of the time with an average win of +2.0R and loses 55% of the time with an average loss of -1.0R has an expectancy of +0.35R per trade — meaning for every unit of risk, you can expect to earn 0.35 units on average over a large sample of trades. That single number tells you more than win rate ever could.
Alongside expectancy, track:
- Profit factor (gross profit ÷ gross loss) — above 1.3 is solid, above 1.5 is strong, below 1.0 means the strategy is losing money regardless of win rate.
- Maximum drawdown — keep it under 15% of account equity; past that, both the account and your discipline start struggling to recover.
- R-multiple per trade, so setups of different sizes stay comparable.
Step 5: Watch Out for Overfitting
If your backtest shows an almost perfect equity curve with no losing streaks, be suspicious rather than excited. Tightening rules to fit the past too precisely is a classic trap, since common pitfalls to avoid include survivorship bias, look-ahead bias, and curve fitting – which can lead to unrealistic performance expectations. A robust strategy should show believable, not flawless, results — including real losing stretches.
Step 6: Journal Every Live Trade the Same Way
Once you go live, the backtest log becomes a trading journal. For each trade record: date/session, setup name, entry and exit price, stop and target, position size, R-multiple result, and — crucially — whether you followed your own rules. A trade that loses because the market moved against a valid setup is very different from a trade that loses because you skipped your stop.
Example: Imagine testing an ICT-style setup on NQ futures — entering after a liquidity sweep of the Asian session low, with a fixed 1% risk per trade. After 120 backtested trades over 18 months, you calculate a 42% win rate, average win of 2.1R, average loss of 1R. Expectancy = (0.42 × 2.1) − (0.58 × 1) = +0.30R per trade. That's a workable edge on paper — the next step is confirming it holds on out-of-sample data and then in a live or simulated journal before scaling size.
Step 7: Review on a Schedule, Not Just When You're Frustrated
A weekly or monthly review turns raw numbers into improvement. Scan recent performance, filter by setup to see which one is carrying results and which is bleeding, and write down one concrete change for next period — not five. One honest adjustment, repeated consistently, compounds far more than a pile of untested tweaks.
Backtest First, Then Scale In Gradually
Even a strategy that passes every test deserves a cautious rollout. A sensible path many educators recommend: transition from backtest to live trading gradually — paper trade, then trade small (25 to 50% size), then scale up based on data. Your journal from this live phase is what confirms (or disproves) that the backtest results survive contact with real execution, slippage, and your own emotions.
Final Word
Backtesting tells you whether a strategy could work. Journaling tells you whether it actually does, in your hands, under real conditions. Neither one guarantees future profits — markets change, and past performance is never a promise. But without this process, you're trading on belief instead of evidence.
Risk reminder: Trading futures, forex, and other leveraged instruments carries a high level of risk and can result in losses exceeding your initial investment. Backtests and journals help you manage risk and evaluate a strategy objectively — they do not guarantee future results. This article is for educational purposes only and is not financial advice.
If you want to see how this kind of process applies to real setups on Nasdaq futures and other instruments, keep an eye on TYS's ongoing analysis — we break down the thinking behind each trade idea, not just the signal.